|
This collaborative project aims to understand the mechanics and physics of earthquake faults, mainly through theoretical and computational modeling, constrained by laboratory experiments and observations of fault slip ranging from large subduction earthquakes to slow slip and tremor.
This work will contribute to earthquake predictability, early warning systems, and preparation for natural seismic hazards.
We are working to answer questions such as:
- How do earthquakes start?
- What determines where on a fault an earthquake will start?
- And what determines where the rupture will stop?
To answer these questions, we are developing increasingly realistic models that include geometrical complexity (i.e., faults that are not planar), heterogeneous media (i.e., faults that have areas of different roughness), and the influence of neighboring faults.
Through laboratory experiments, we are exploring how friction depends on pressure, temperature, and speed, and are incorporating these results into our models.
And we are developing more sophisticated computational methods that can simulate processes of very different time scales, including both sudden seismic events (earthquakes) as well as long-term aseismic slip (the time in between earthquakes).
Research Highlight:
 Under the hood of the earthquake machine
|
|

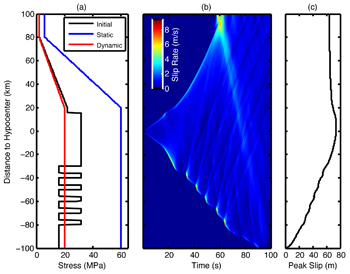
Figure 1. Calculated slip rate and total amount of slip for the 2011 Tohoku-Oki, Japan Earthquake, using a 2-Dimensional dynamic rupture model - a) Initial distribution of depth-dependent stress along the fault before rupture. b) Resulting slip rate as a function of time and distance from the hypocenter. The rupture is seen to propagate bilaterally from the hypocenter. Near the trench (top of figure) a supershear rupture front emerges ahead of the main front, accompanied by an acceleration of slip rate up to 6.5 m/s, due to the free surface. c) Peak slip as a function of distance to the hypocenter. Near the shallow region, the final amount of slip is between 64 and 74 m (about 230 feet).
(Huang, Meng, and Ampuero, 2012)
|

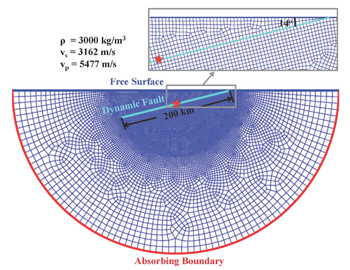
Figure 2. Mesh used in the model, showing the variable spatial resolution - The inset zooms in on the high-density mesh around the fault (turquoise line). The hypocenter (red star) is in the middle of the 200 km-long fault
(Huang, Meng, and Ampuero, 2012)
|
|

